


环境准备ELFK
elasticsearch7.9.1 + filrebeat7.9.1 + kibana7.9.1 + Nginx1.24
Nginx
比较简单,自行安装,这里采集日志文件为“/data/elk/sdk.google.log”
Elasticsearch
下载安装
下载
wget https://artifacts.elastic.co/downloads/elasticsearch/elasticsearch-7.17.21-x86_64.rpm

导入公共签名秘钥
rpm --import https://artifacts.elastic.co/GPG-KEY-elasticsearch

安装
rpm -ivh elasticsearch-7.17.21-x86_64.rpm
配置文件
备份配置文件
cp /etc/elasticsearch/elasticsearch.yml /etc/elasticsearch/elasticsearch.yml.bak

保留以下配置文即可
[root@message elk]# egrep -v "#|^$" /etc/elasticsearch/elasticsearch.yml
node.name: node-1
path.data: /var/lib/elasticsearch
path.logs: /var/log/elasticsearch
network.host: 172.16.49.130,127.0.0.1
http.port: 9200
discovery.seed_hosts: ["172.16.49.130"]
cluster.initial_master_nodes: ["172.16.49.130"]

写入以下配置文件
cat > /etc/elasticsearch/elasticsearch.yml << 'EOF'
node.name: node-1
path.data: /var/lib/elasticsearch
path.logs: /var/log/elasticsearch
network.host: 172.16.49.130,127.0.0.1
http.port: 9200
discovery.seed_hosts: ["172.16.49.130"]
cluster.initial_master_nodes: ["172.16.49.130"]
EOF
启动测试访问
启动es
systemctl start elasticsearch.service

查看启动状态
systemctl status elasticsearch.service

开机自启
systemctl enable elasticsearch.service

测试访问
[root@message elk]# curl 127.0.0.1:9200
{
  "name" : "node-1",
  "cluster_name" : "elasticsearch",
  "cluster_uuid" : "Ja6n8Gh-TduBlzAeQgLlxg",
  "version" : {
    "number" : "7.17.21",
    "build_flavor" : "default",
    "build_type" : "rpm",
    "build_hash" : "d38e4b028f4a9784bb74de339ac1b877e2dbea6f",
    "build_date" : "2024-04-26T04:36:26.745220156Z",
    "build_snapshot" : false,
    "lucene_version" : "8.11.3",
    "minimum_wire_compatibility_version" : "6.8.0",
    "minimum_index_compatibility_version" : "6.0.0-beta1"
  },
  "tagline" : "You Know, for Search"
}
修改ES内存大小(可选)
修改以下配置文件,默认4G
vim /etc/elasticsearch/jvm.options
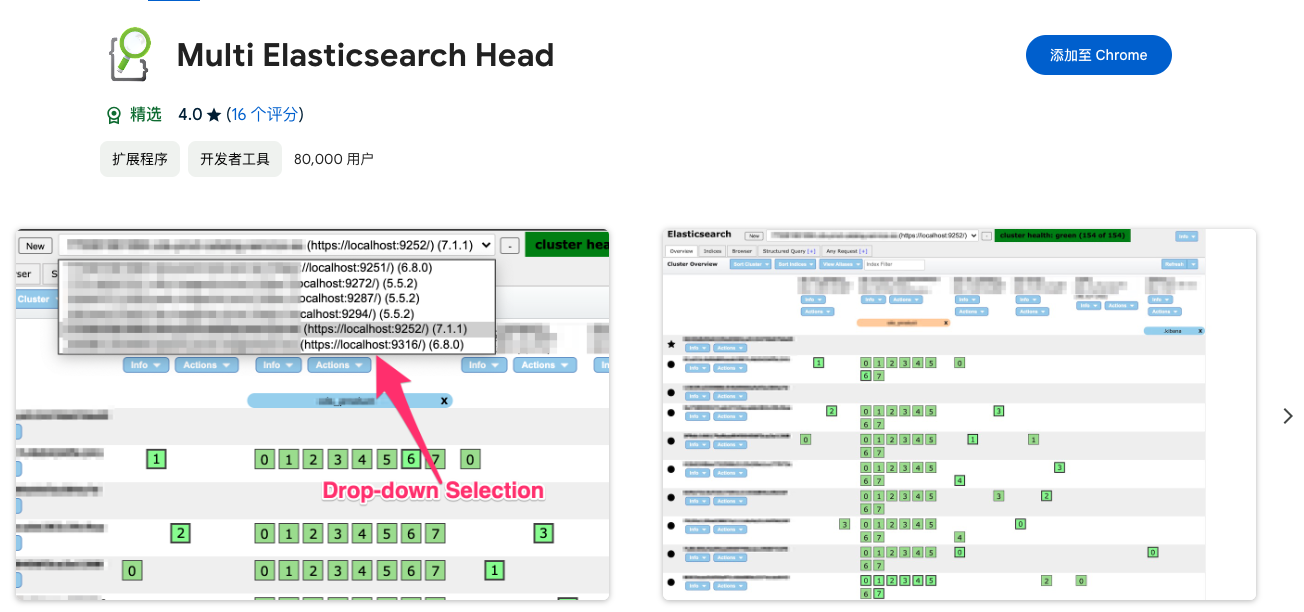
ElasticSearch Head可视化
安装可视化方便进行操作
在Chrome应用商店搜索Elasticsearch Head并安装
Filebeat
下载安装
下载
wget https://artifacts.elastic.co/downloads/beats/filebeat/filebeat-7.9.1-x86_64.rpm

安装
rpm -ivh filebeat-7.9.1-x86_64.rpm
配置文件
备份配置文件,如果不是本机修改localhost
cp /etc/filebeat/filebeat.yml /etc/filebeat/filebeat.yml.bak

写入以下配置文件
cat > /etc/filebeat/filebeat.yml << 'EOF'
filebeat.inputs:
- type: log
  enabled: true
  paths:
    - /data/elk/sdk.google.log
output.elasticsearch:
  hosts: ["172.16.49.130:9200"]
setup.ilm.enabled: false
setup.template.enabled: false
EOF
启动
systemctl start filebeat.service
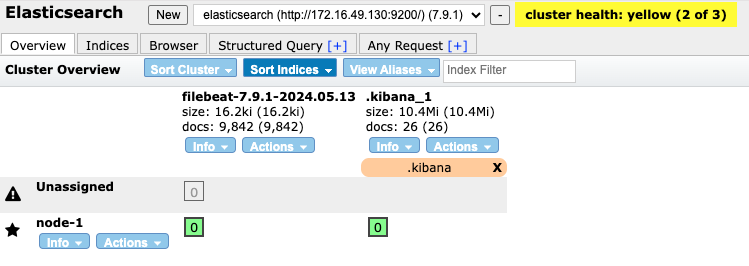
systemctl status filebeat.service查看效果
此时在ES界面可以看到filebeat索引以及收集到的日志信息
kibana
下载安装
下载
wget https://artifacts.elastic.co/downloads/kibana/kibana-7.9.1-x86_64.rpm

安装
rpm -ivh kibana-7.9.1-x86_64.rpm
配置文件
备份配置文件
cp /etc/kibana/kibana.yml /etc/kibana/kibana.yml.bak

将以下内容写入配置文件
cat > /etc/kibana/kibana.yml << 'EOF'
server.port: 5601
server.host: "172.16.49.130"
elasticsearch.hosts: ["http://172.16.49.130:9200"]
EOF
启动
systemctl start kibana.service
systemctl status kibana.service
日志展示
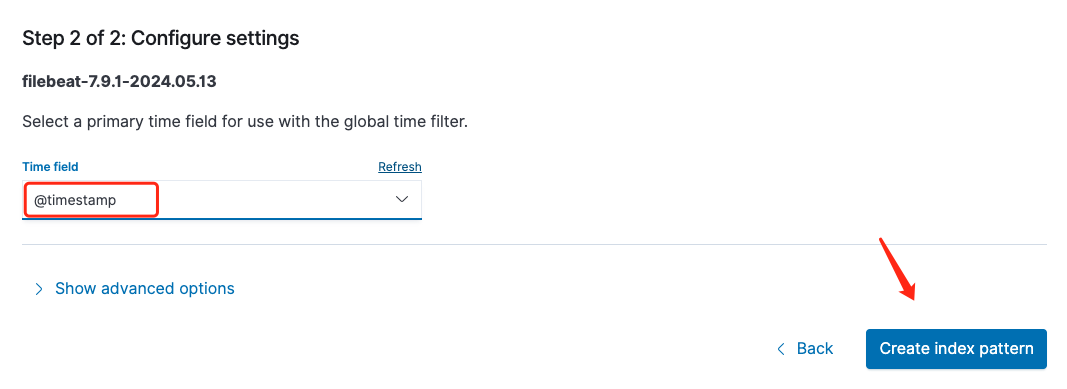
创建索引
访问Kibana的Discover页面,创建对应索引
http://172.16.49.130:5601/app/management/kibana/indexPatterns

按照时间进行排序,创建
查看
返回主页-Discover界面,即可看到对应的日志信息
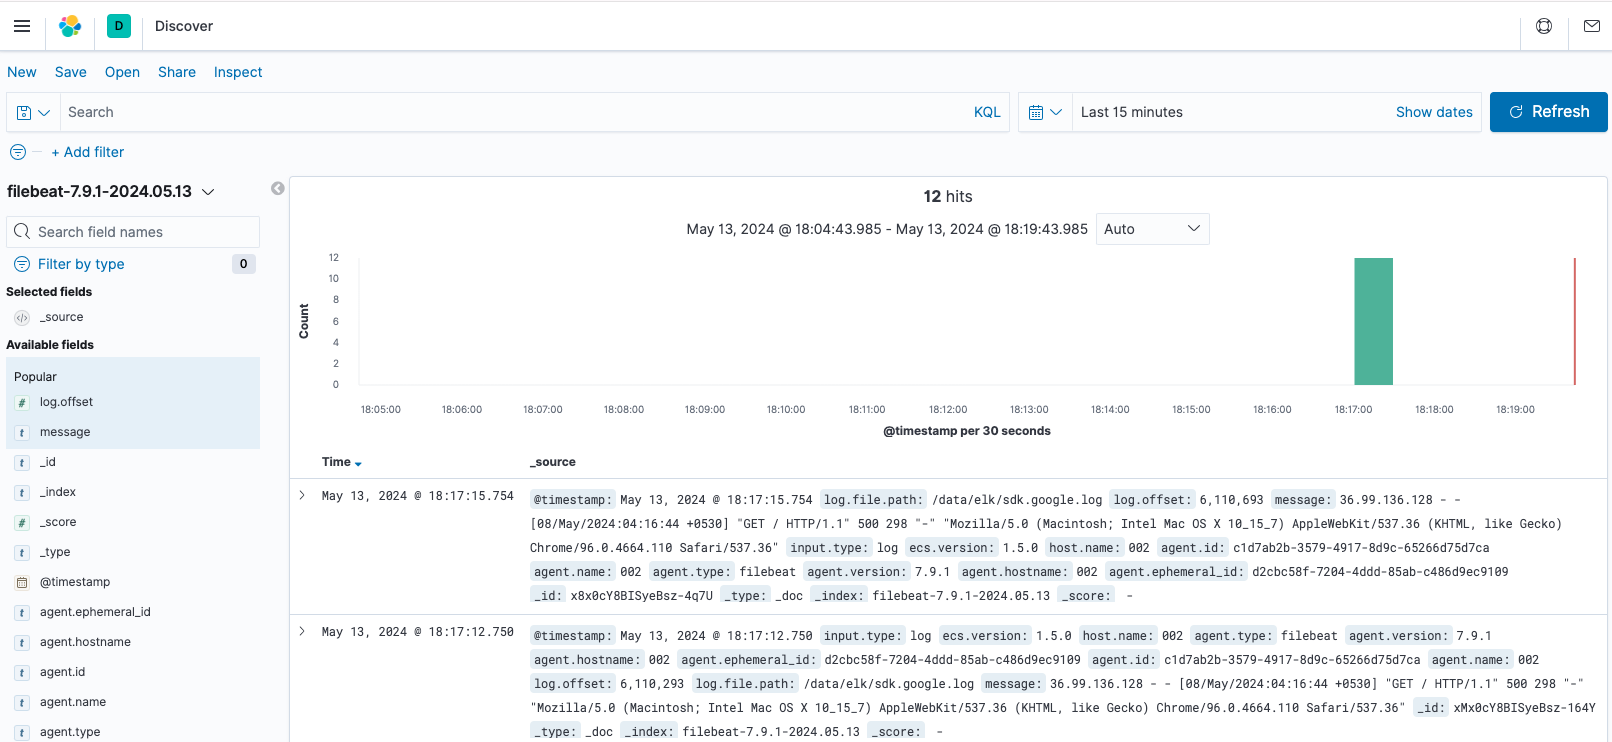
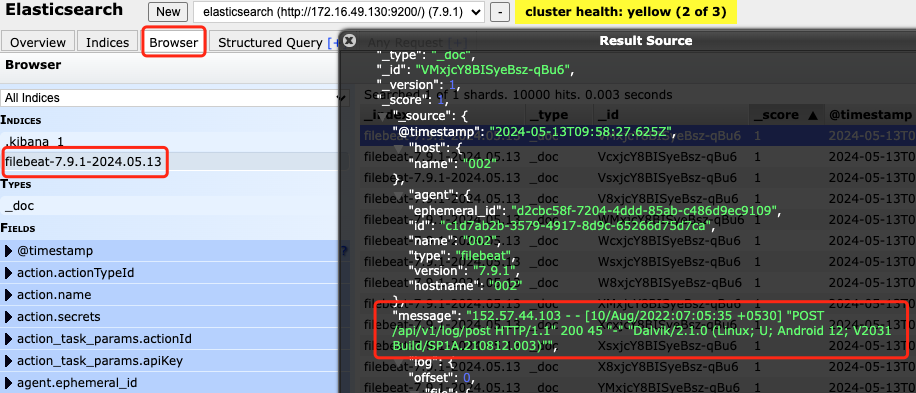
思考
不合理
1、日志的字段都在一个message里,不能拆分单独显示,比如IP地址,请求路径,状态码等。
2、日志索引的名称不明确,没有见名知意。
3、索引生成的数量不合理,默认这样每天一个索引,将会很不方便。
期望结果
1、能够自定义索引的名称,见名知意,比如:nginx_access_202405
2、日志的字段更加细分化